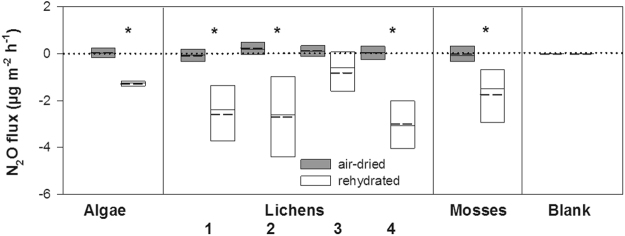
Figure 2.
N2O fluxes in cryptogams sampled from beech bark in Conventwald, Black Forest. Fluxes are expressed per unit of stem projected area. The plotted results are medians (solid lines) and means (broken lines) of three measurement repetitions in air-dried and rehydrated cryptogams (n = 3). The following samples were investigated. Algae – red alga/Rhodophyta. Lichens: sample 1 – lichen Graphis scripta with identified Cryptosporiopsis sp. and Pezicula sp. fungi; sample 2 – mixture of lichens Graphis scripta and Lecanora sp.; sample 3 – lichen (undetermined); sample 4 – lichen Pseudevernia furfuracea (sampled from beech branch). Mosses – Hypnum cupressiforme. Blank samples (represented by dry and wet filter papers) were also analysed to exclude the possibility that N2O was diluted in water or leaked from the system (see Methods). For box plot description, see Fig. 1. Statistically significant differences in fluxes between air-dried and rehydrated organisms at p < 0.05 are indicated by asterisk.

