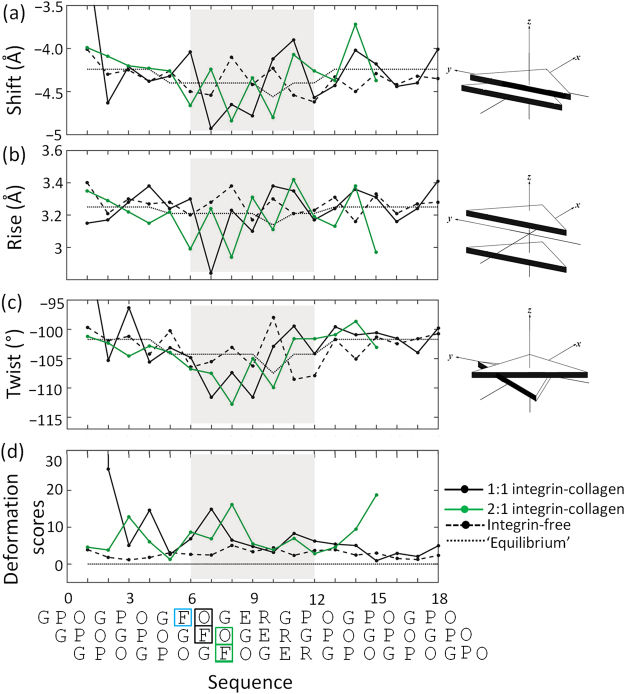
Figure 4.
(a) Shift, (b) Rise, (c) Twist, (d) deformation scores of integrin-bound complexes (PDB: 1DZI, 4BJ3) and integrin-free (DPB: 1Q7D) triple helices with the same sequence14,35,36. The mean step parameter values, or ‘equilibrium states’ are listed in Table S3. The integrin-bound region is shaded in grey. The sequences are aligned by step number. The Phe and Hyp residues contacted by integrin Asn154 and Leu296 are framed by color-coded rectangles: black for the 1:1 complex; green for integrin molecule A; light blue for integrin molecule B (contact only to Phe).

