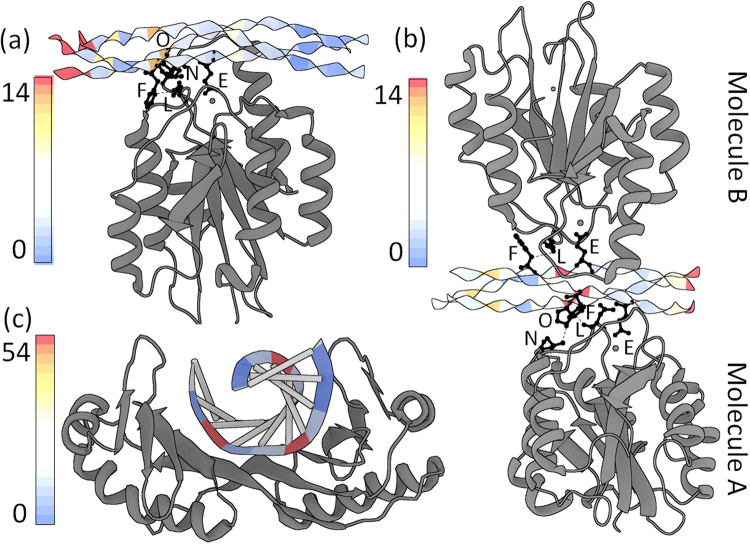
Figure 5.
Deformed triple helices in integrin-collagen complexes and double helices in a protein-DNA complex. The deformation scores are color-coded and mapped on ribbon representations of collagen in the (a) 1:1 and (b) 2:1 integrin-collagen complexes (PDB ID: 1DZI, 4BJ3)14,36. The same integrin residues, Asn154 and Leu296, contact Phe and Hyp in the various chains of the triple helices. Contacting pairs are shown in ball-and-sticks. The Glu residues involved in the three metal ion-dependent adhesion sites (MIDAS) are also shown in ball-and-stick representations. (c) Corresponding deformation scores and images of the TATA-box DNA-protein complex (PDB ID: 1YTB)37. See supplement for calculation of DNA deformation scores.

