. 2017 Aug 29;8(10):6764–6776. doi: 10.1039/c7sc01845b

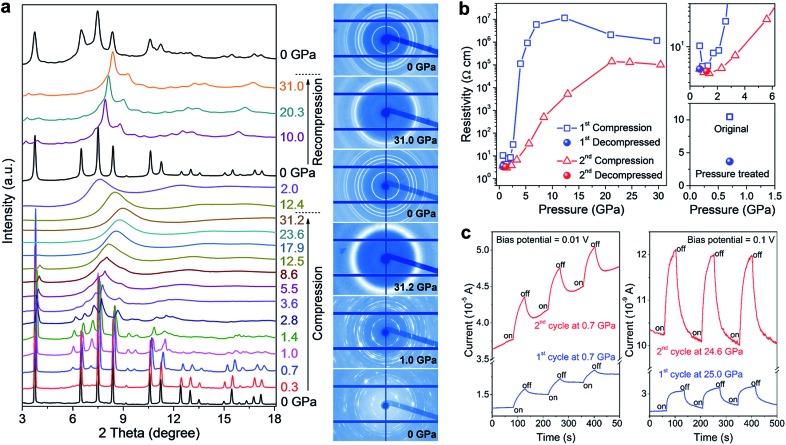
Fig. 6. (a) In situ structural characterization of MASnI3 under high pressure. The left panel shows the XRD patterns collected during two sequential compression–decompression cycles and the right panel shows the raw XRD images at six selected pressures. (b) Pressure-induced resistivity evolution in the two compression–decompression cycles and a comparison of the resistivities before (open square) and after (solid sphere) high-pressure treatment. (c) Photocurrents of MASnI3 before (first cycle) and after (second cycle) pressure treatment, at a low pressure of 0.7 GPa (left panel) and at a high pressure of 25 GPa (right panel). The blue line shows the first cycle and the red line shows the second cycle. Reproduced with permission from ref. 37, copyright 2016, WILEY-VCH Verlag GmbH & Co. KGaA, Weinheim.

Fig. 6