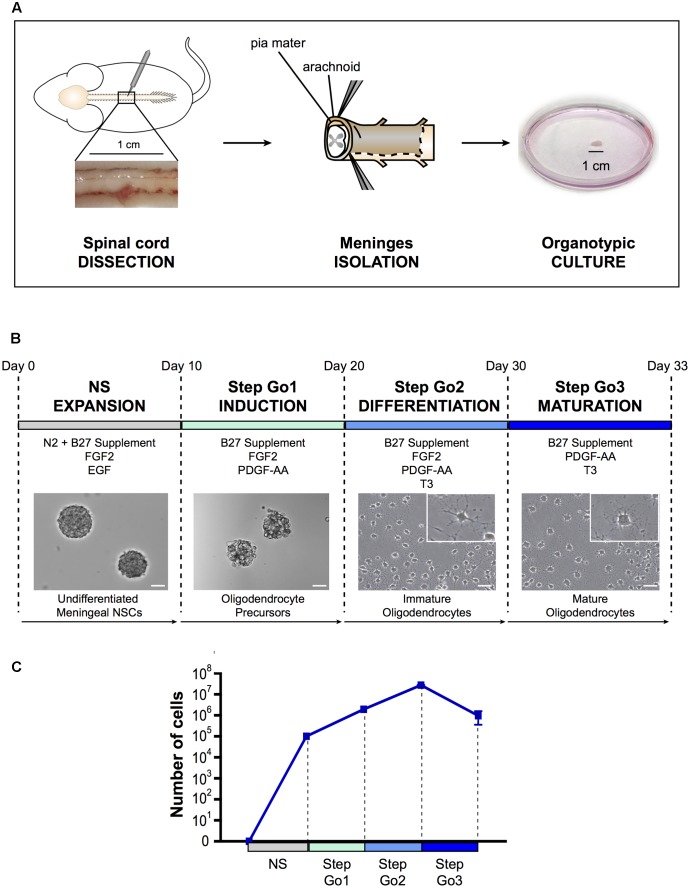
FIGURE 1.
Oligodendrocyte differentiation protocol. (A) Schematic representation of spinal cord meningeal biopsy isolation for organotypic culture. Spinal cord was dissected from adult SD rat and 1 cm of meningeal tissue was isolated and plated in neurosphere expansion medium (NS, day 0). (B) Time course representation of the oligodendrocyte differentiation protocol from spinal cord meningeal biopsy. From day 0 to day 10: neurosphere expansion (NS), from day 10 to day 20: oligosphere culture (Step Go1); from day 20 to day 30: oligodendrocyte differentiation (Step Go2); from day 30 to day 33: oligodendrocyte maturation (Step Go3). Images show meningeal-derived differentiating oligodendrocyte morphology at each stage of the protocol. Insets in (B) are higher magnification images of representative cells in the boxes. Pictures in (B) are brightfield images. (C) Number of meningeal-derived cells in culture, calculated for every experimental replicate (n = 4), present at each stage of the differentiation protocol. Data are presented as mean ± SEM. NSCs: neural stem cells; FGF2: human basic fibroblast growth factor; EGF: epidermal growth factor; PDGF-AA: platelet-derived growth factor type AA; T3: 3,3′,5-triiodo-L-thyronine. Scale bars: 50 μm.

