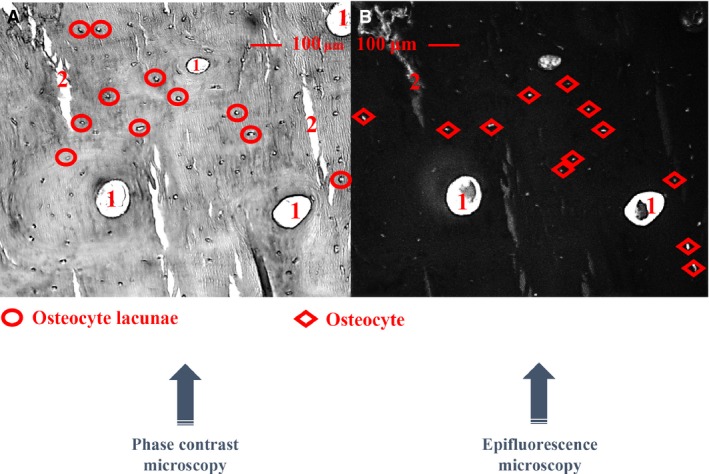
Figure 2.

Each microscopic field (0.55 mm2 for each) was selected randomly, capturing two separate image types, phase contrast (A) and fluorescent (B) images, respectively. Quantification of total osteocyte lacunae and osteocytes per cortical bone area were semi‐automatically performed. 1: Haversian canals, 2: artificial cracks.
