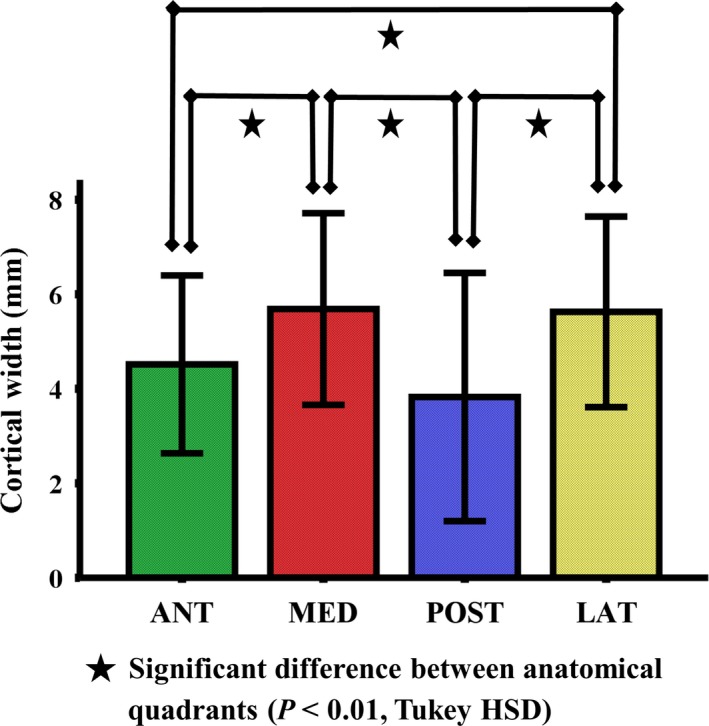
Figure 3.

Mean values of cortical width in four anatomical quadrants of the subtrochanteric femoral shaft (n = 20). The error bars indicate the standard deviation of the mean (SD). The cortical widths in the medial and lateral quadrants were significantly higher than those detected in the anterior and posterior quadrants (P < 0.01).
