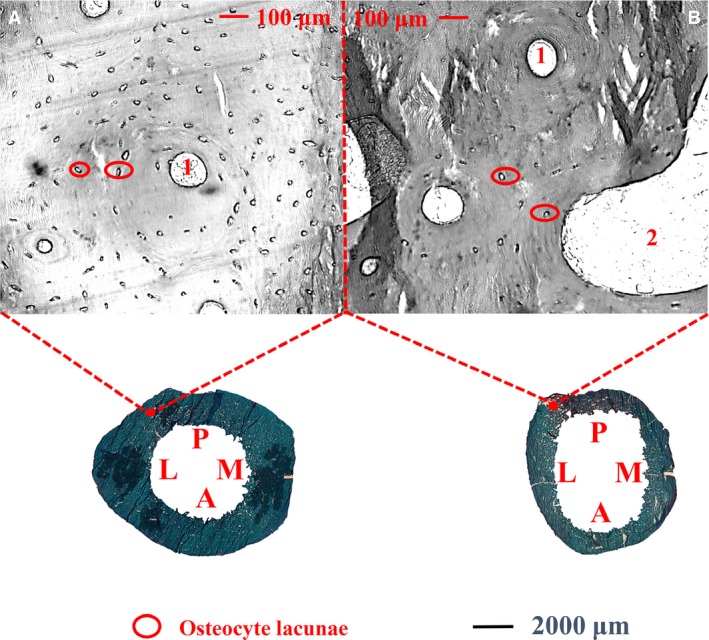
Figure 5.

Cortex of the subtrochanteric femoral shaft shows the variation of osteocyte lacunar number per cortical bone area in each age group (young: A, ≤ 50 years; old: B, > 50 years). Osteocyte lacunae (circled in red) was higher in the group of young subjects (A) than in the group of old subjects (B). 1: Haversian canals, 2: cortical pores. M: medial; P: posterior; L: lateral; A: anterior.
