Figure 1.

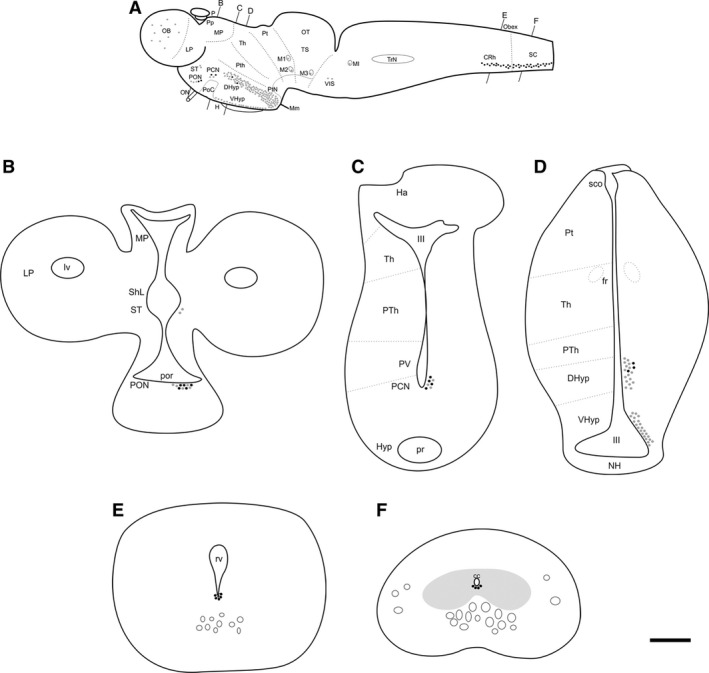
Schematic drawings of a lateral view (A) and transverse sections (B–F) of the brain of the sea lamprey showing the distribution and location of double‐labelled DA‐ir⁄GLU‐ir cells (black dots) in comparison with the distribution of DA‐ir cells (grey dots). Note that a dot may not represent a single neuron. Black lines on top and bottom of (A) indicate the plane of section of the transverse schematics in (B–F). In (B–F) the location of the cells is shown only for the right side with the name of the regions on the left side. cc, central canal; CRh, caudal rhombencephalon; DHyp, dorsal hypothalamus; H, hypophysis; Ha, habenula; III, third ventricle; LP, lateral pallium; lv, lateral ventricle; M1‐3 and MI, giant Müller cells; Mm, mammillary nucleus; MP, medial pallium; NH, neurohypophysis; OB, olfactory bulbs; ON, optic nerve; OT, optic tectum; P, pineal organ; PCN, postoptic commissure nucleus; PON, preoptic nucleus; PoC, postoptic commissure; por, preoptic recess; Pp, parapineal organ; pr, posterior hypothalamic recess; Pt, pretectum; PTh, prethalamus; PtN, paratubercular nucleus; PV, paraventricular nucleus; rv, rhombencephalic ventricle; SC, spinal cord; sco, subcommissural organ; ShL, subhippocampal lobe; ST, striatum; Th, thalamus; TrN, trigeminal nucleus; TS, torus semicircularis; VIS, ventral isthmus; VHyp, ventral hypothalamus. Scale bar: 800 μm (A) and 125 μm (B–F). Modified from Barreiro‐Iglesias et al. (2009b) and Villar‐Cerviño et al. (2011, 2013).
