. 2017 Jul 13;8(10):6829–6835. doi: 10.1039/c7sc01316g

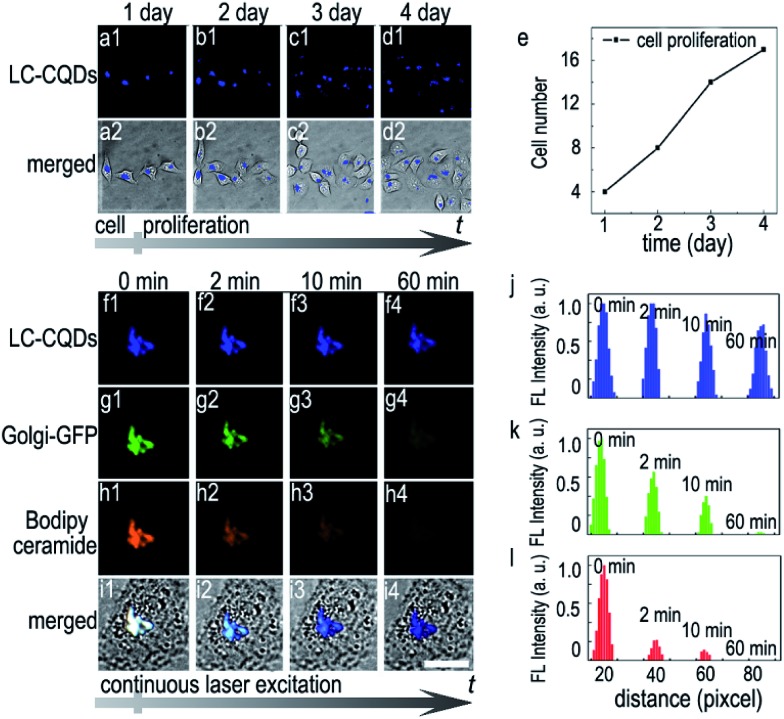
Fig. 3. The in situ long-term Golgi imaging ability of the LC-CQDs. (a–d) The number of the same group of HEp-2 cells increases from 4 to 17 due to cell proliferation when the Golgi is stained with LC-CQDs. (a1–d1) Fluorescence images of the same group of cells on different days. (a2–d2) Merged images of the fluorescence and bright field images. (e) The plot of cell number with increasing time. (f–i) Photostability of the LC-CQDs (blue), Golgi-GFP (green, Golgi specific green fluorescent protein) and Bodipy ceramide (red, Golgi dye) in cells under continuous laser excitation. Scale bar, 10 μm. (j–l) Changes of the fluorescence intensities of the LC-CQDs (blue), Golgi-GFP (green) and Bodipy ceramide (red) in cells under continuous laser excitation; calculated by Image-Pro Plus 6.0. Scale bar, 20 μm.

Fig. 3