. 2017 Jul 13;8(10):6829–6835. doi: 10.1039/c7sc01316g

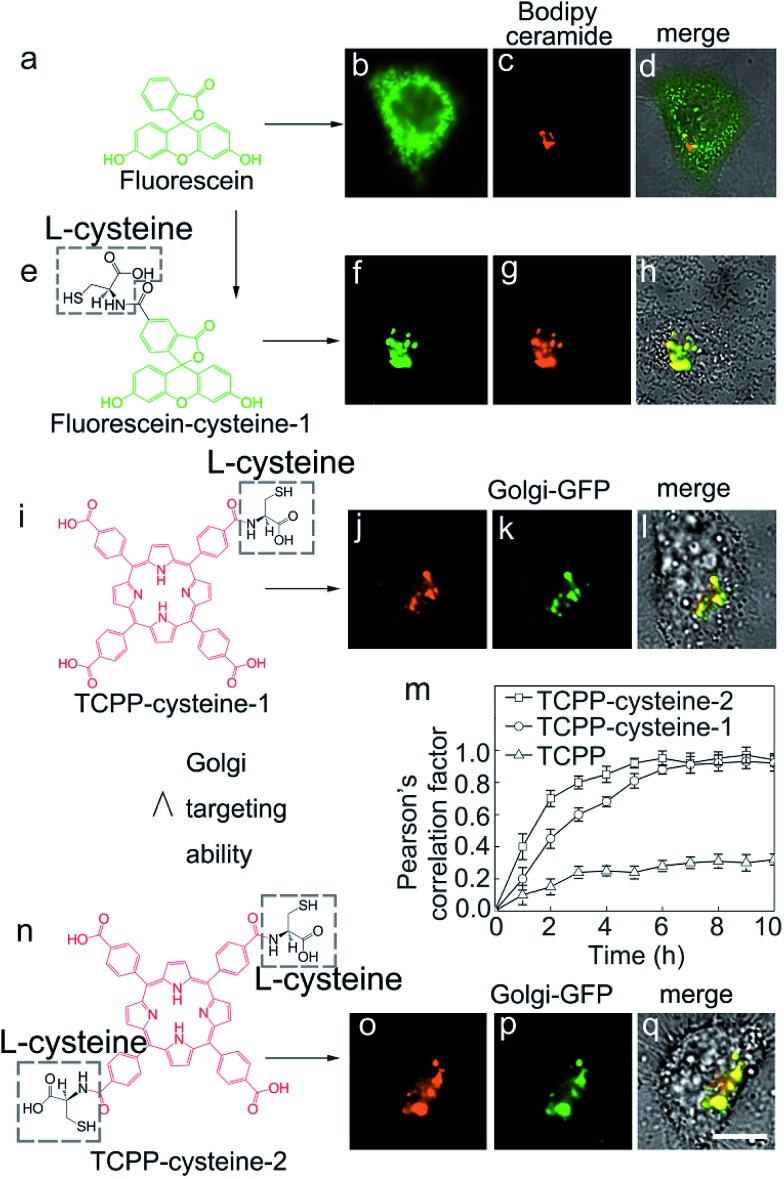
Fig. 4. The Golgi targeting ability of l-cysteine functionalized molecules. (a) Chemical structure of fluorescein. (b) Fluorescence image of fluorescein in an HEp-2 cell. (c) Fluorescence image of Bodipy ceramide (red, Golgi specific dye). (d) Merged image of fluorescein, Bodipy ceramide and the cell. (e) Chemical structure of fluorescein–cysteine-1. (f) Fluorescence image of fluorescein. (g) Fluorescence image of Bodipy ceramide (red, Golgi specific dye). (h) Merged image of fluorescein–cysteine-1, Bodipy ceramide and the cell. (i) Chemical structure of TCPP–cysteine-1. (j) Fluorescence image of TCPP–cysteine-1. (k) Fluorescence image of GalNAcT-GFP (Golgi-GFP, Golgi specific green fluorescent protein). (l) Merged image of TCPP–cysteine-1, GalNAcT-GFP and the cell. (m) Pearson’s correlation factor between TCPP–cysteine-2/TCPP–cysteine-1/TCPP and GalNAcT-GFP at different times. Calculated using Image-Pro Plus 6.0. The error bars represent the standard deviations from the five replicate experiments. (n) Chemical structure of TCPP–cysteine-2. (o) Fluorescence image of TCPP–cysteine-1. (p) Fluorescence image of GalNAcT-GFP. (q) Merged image of TCPP–cysteine-2, GalNAcT GFP and the cell. Scale bar, 10 μm.

Fig. 4