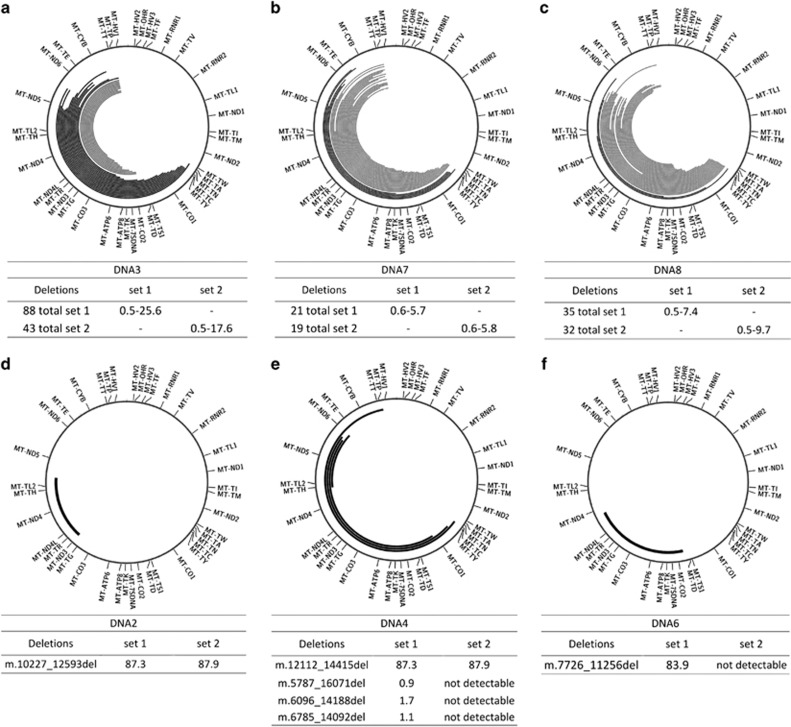
Figure 2.
Graphical representation of the deletions found in six patients with known or suspected mitochondrial disease. In black, deletions identified by both Pindel and the custom script. In grey, breakpoints identified only with the custom script. (a) Sequencing of a patient (DNA3) carrying the mutation in the Twinkle gene, known to be associated with the formation of multiple deletions. The plot shows the 30 deletions with highest frequency, the full dataset can be found in Supplementary Table 5. (b,c) sequencing results of two other patients (DNA7 and DNA8) with a suspicion of mitochondrial disease found to carry multiple deletions at low frequency. Extensive data can be found in Supplementary Tables 6 and 7. (d–f) show the results of patients carrying single deletions (DNA2, DNA4 and DNA6). The tables show the breakpoints and the retrieved frequencies with the different primer sets. All values are percentages. ‘Not detectable’: outside the amplicon of set 2.

