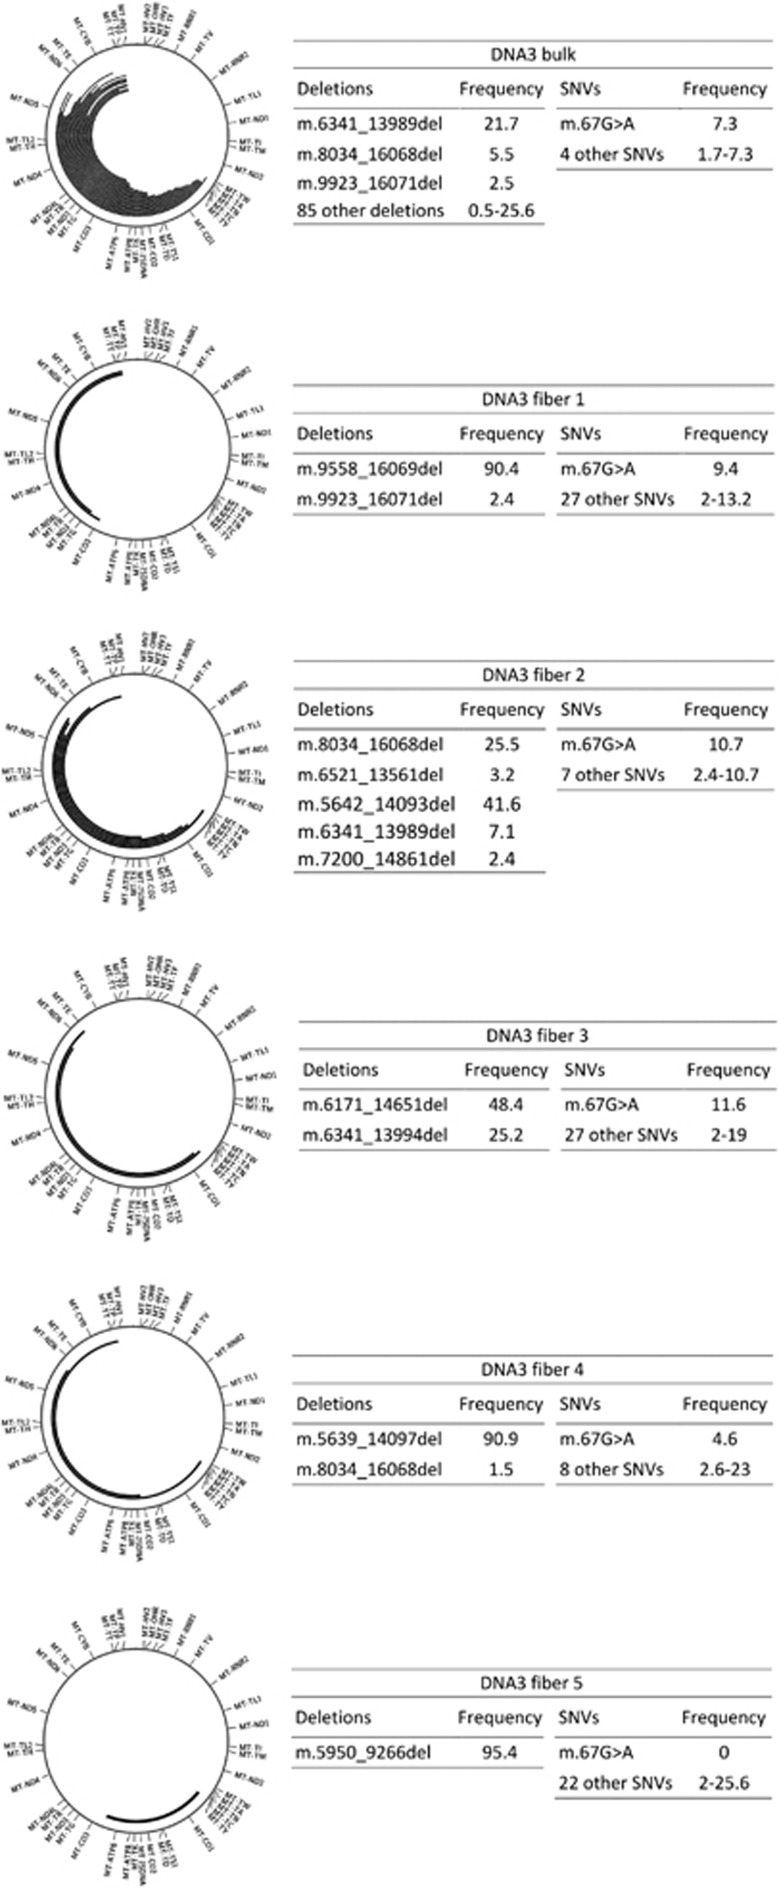
Figure 3.
Overview of the deletions and SNVs found in five single COX− muscle fibers, as compared with the analysis of the bulk DNA extracted from muscle homogenate. The large deletions are represented in the circos plots and their frequencies, along with that of the SNVs are in the adjacent boxes (all values are percentages). We have highlighted the variant m.67A>G, present in most cells and in the bulk DNA.

