
FIGURE 4.
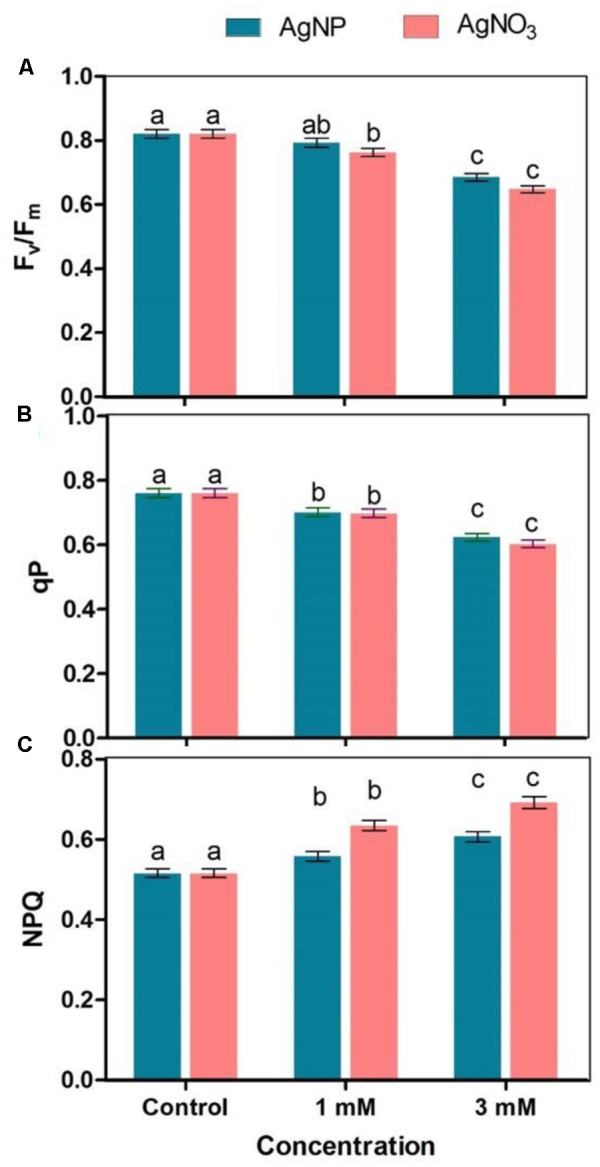
Effect of different concentrations of AgNPs and AgNO3 on photosynthetic parameters such as (A) Fv/Fm, (B) qP: photochemical quenching, and (C) NPQ, non-photochemical quenching. Data are average ± standard errors of experiments performed in triplicate. Bars followed by different letter(s) show significant difference at P < 0.05 significance level according to the DMRT.