FIGURE 9.

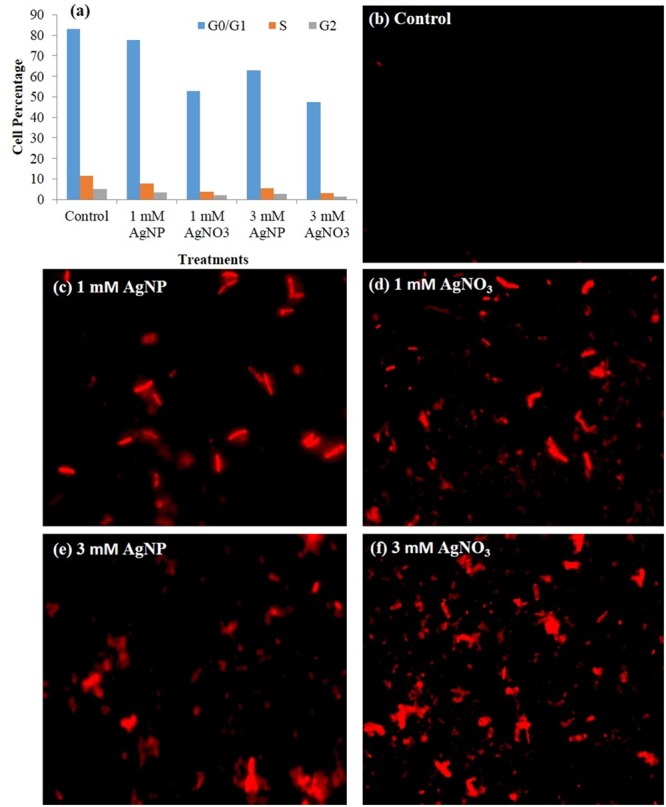
(a) Cell cycle profile of plant analyzed by flow cytometry showing percent of cells in each phase, (b–f) Fluorescence microscopy images of plant cells treated with different concentrations of AgNP and AgNO3, and stained with PI.

(a) Cell cycle profile of plant analyzed by flow cytometry showing percent of cells in each phase, (b–f) Fluorescence microscopy images of plant cells treated with different concentrations of AgNP and AgNO3, and stained with PI.