
Fig. 7.
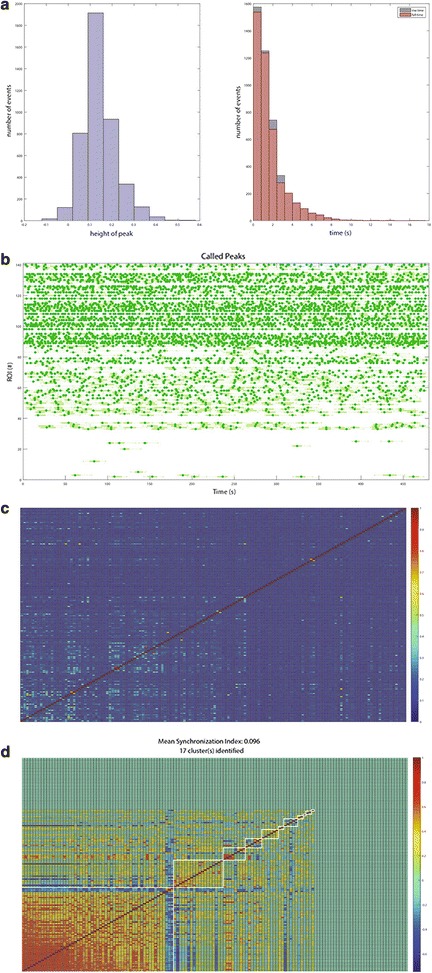
Typical functional output for a high-content Ca2+ imaging experiment. a Histograms, b raster plots, c correlation, and d synchronization indexes can be calculated for large numbers of cells to determine group characteristics of calcium transients in a high-throughput screen. The heat maps and synchronization index can give the end user a measure of the functional connectivity in a given dataset. In this dataset the Ca2+ transients are not functionally connected, as evidenced by no bursting patterns in the raster plot, low autocorrelations in the heat map, and a synchronicity index of 0.096. This is to be expected, as these transients were recorded from neural progenitors at day 21 derived from human iPSCs