
Fig. 2.
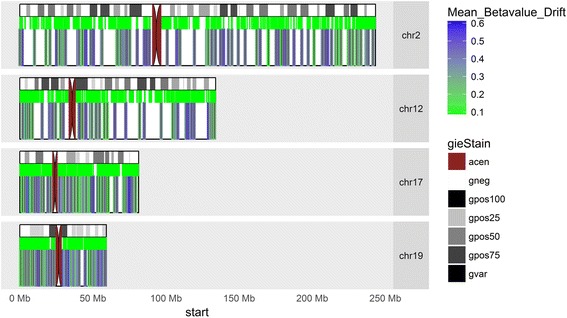
Representative karyographs of four autosomes. Chromosomes 2 and 12 exhibit typical methylomic drift patterns while chromosomes 17 and 19 exhibit high-density methylomic drift. Top track: chromosome banding. Middle track: array-based CpG island positions. Bottom track: positions of CpG islands that undergo methylomic drift in 64 BE samples (mean levels color-coded)