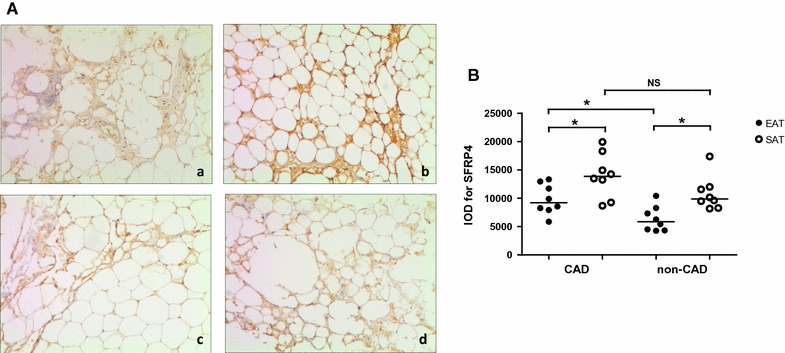
Fig. 2.

Immunohistochemical analysis for SFRP4 in human adipose tissue. A representative slides of adipose tissue from patients in the CAD group (A-a, EAT; A-b, SAT) and the non-CAD group (A-c, EAT; A-d, SAT) (magnified × 100). B results of quantitative immunohistochemical analysis for SFRP4 in EAT and SAT of the two groups (CAD group, n = 8; non-CAD group, n = 8). *P < 0.05. CAD coronary artery disease, EAT epicardial adipose tissue, SAT subcutaneous adipose tissue, IOD integrated optical density, NS not significant
