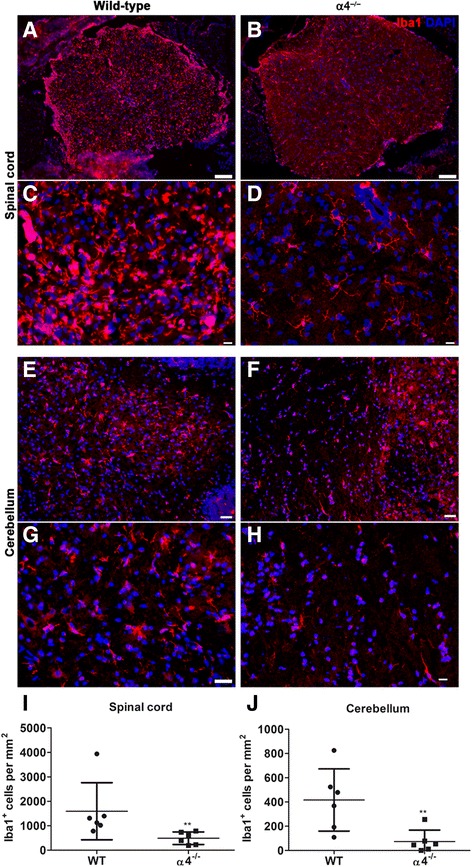
Fig. 2.

Assessment of microgliosis in wild-type and T cell-conditional α4−/− mice subjected to EAE. Immunofluorescence staining for Iba1 of lumbar spinal cord sections reveals increased frequency of Iba+ cells in wild-type (a) compared to T cell-conditional α4−/− mice (b). Note that at higher magnification, the microglia appeared morphologically different in wild-type (c) in comparison to T cell-conditional α4−/− mice (d). Similar observations were made in the cerebellum of wild-type (e, g) and T cell-conditional α4−/− mice (f, h). Bars = 200 μm (a, b), 50 μm (c, d, g, h), and 100 μm (e, f). Representative images for wild-type (n = 6) and T cell-conditional α4−/− mice (n = 6). The density (cells/mm2) of Iba+ cells was counted in the spinal cord (i) and cerebellum (j) in identical regions of wild-type and T cell-conditional α4−/− mice. Each point represents data from one mouse. Here, we used the Mann-Whitney test for statistics; **p < 0.01
