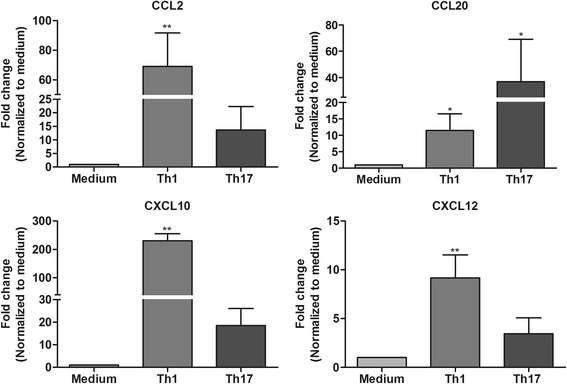
Fig. 5.

Chemokine expression profile in astrocytes exposed to medium and Th1 or Th17 supernatants. Fold changes in CCL2, CCL20, CXCL10, and CXCL12 mRNA expression in Th1- and Th17-treated astrocytes compared to medium control were measured by RT-PCR. The results are mean ± SEM with *p ≤ 0.05 and **p ≤ 0.01 of a minimum of four independent experiments (n = 4)
