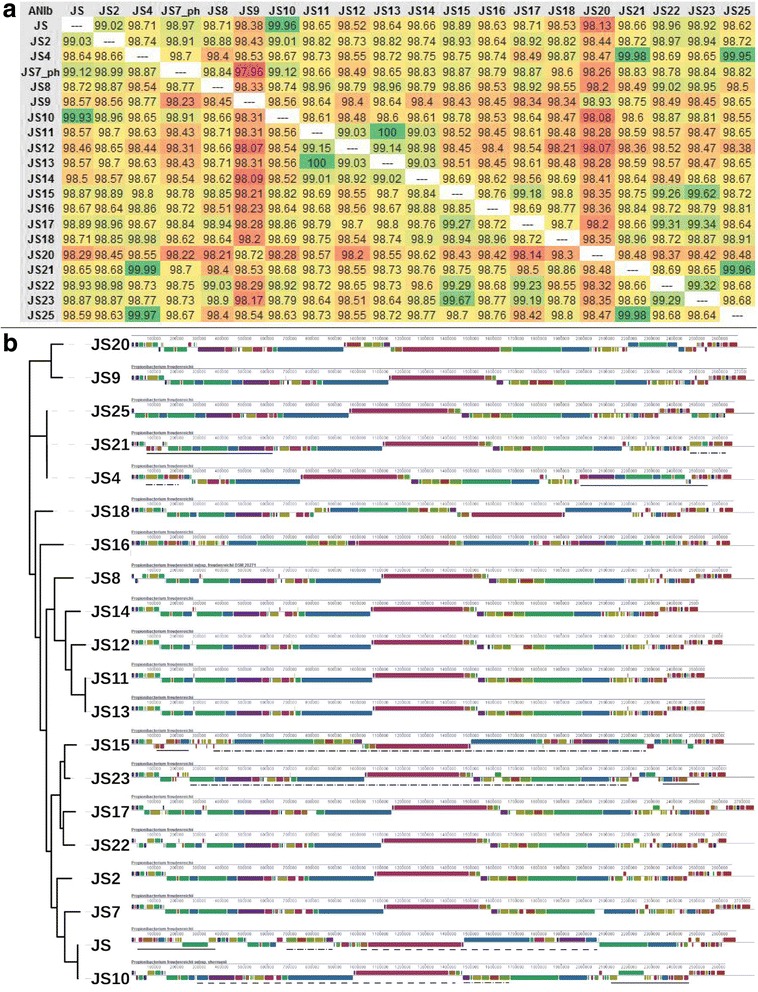
Fig. 1.

Genome composition and organisation. Panel a) Average Nucleotide Identity (%) calculated based on pairwise BLAST alignment (ANIb). The levels of similarity are highlighted by coloring from green for the most similar to red for the most dissimilar. The strains JS4, JS15 and JS17 are on average the most similar to all other strains, while the strains JS9 and JS20 are the most dissimilar to all other strains and only slightly more similar to one another. The strains of cereal origin (JS11-JS14) are more similar to each other than to other strains. Panel b) Whole genome alignments generated with ProgressiveMauve. The genomes are arranged according to the phylogenetic tree generated from core genome alignments (see below). The distinct organisation of the genomes of closely related strains can be observed, most clearly between strains JS and JS10, JS15 and JS23 as well as JS4 and JS21. The regions of genome rearrangements in these strains are indicated with matching lines (solid, dot-dash or dash)
