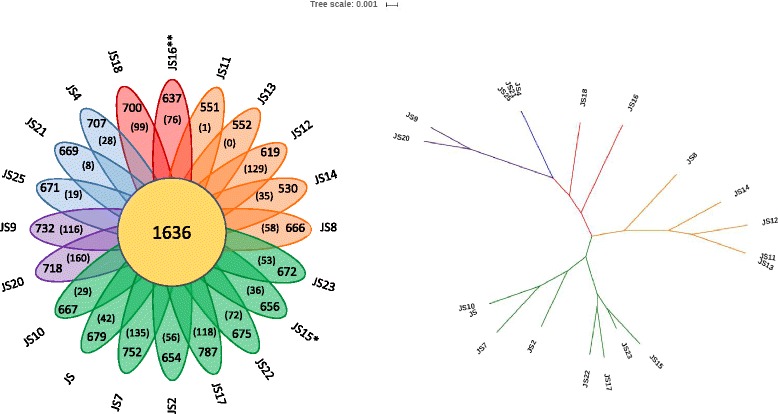
Fig. 3.

Flower plot representing comparative analysis of the genome. The orthologous groups shared between the strains are indicated in the center. The number of accessory genes for each strain are indicated on each petal. In the brackets are the genes unique to that strain. The petals are colored based on the degree of relatedness of the strains. The unrooted phylogenetic tree was created based on the core genome alignments. *Type strain P. freudenreichii DSM 4902; **Type strain P. freudenreichii DSM 20271 (CP010341)
