. 2017 Jul 24;8(10):6836–6851. doi: 10.1039/c7sc02266b

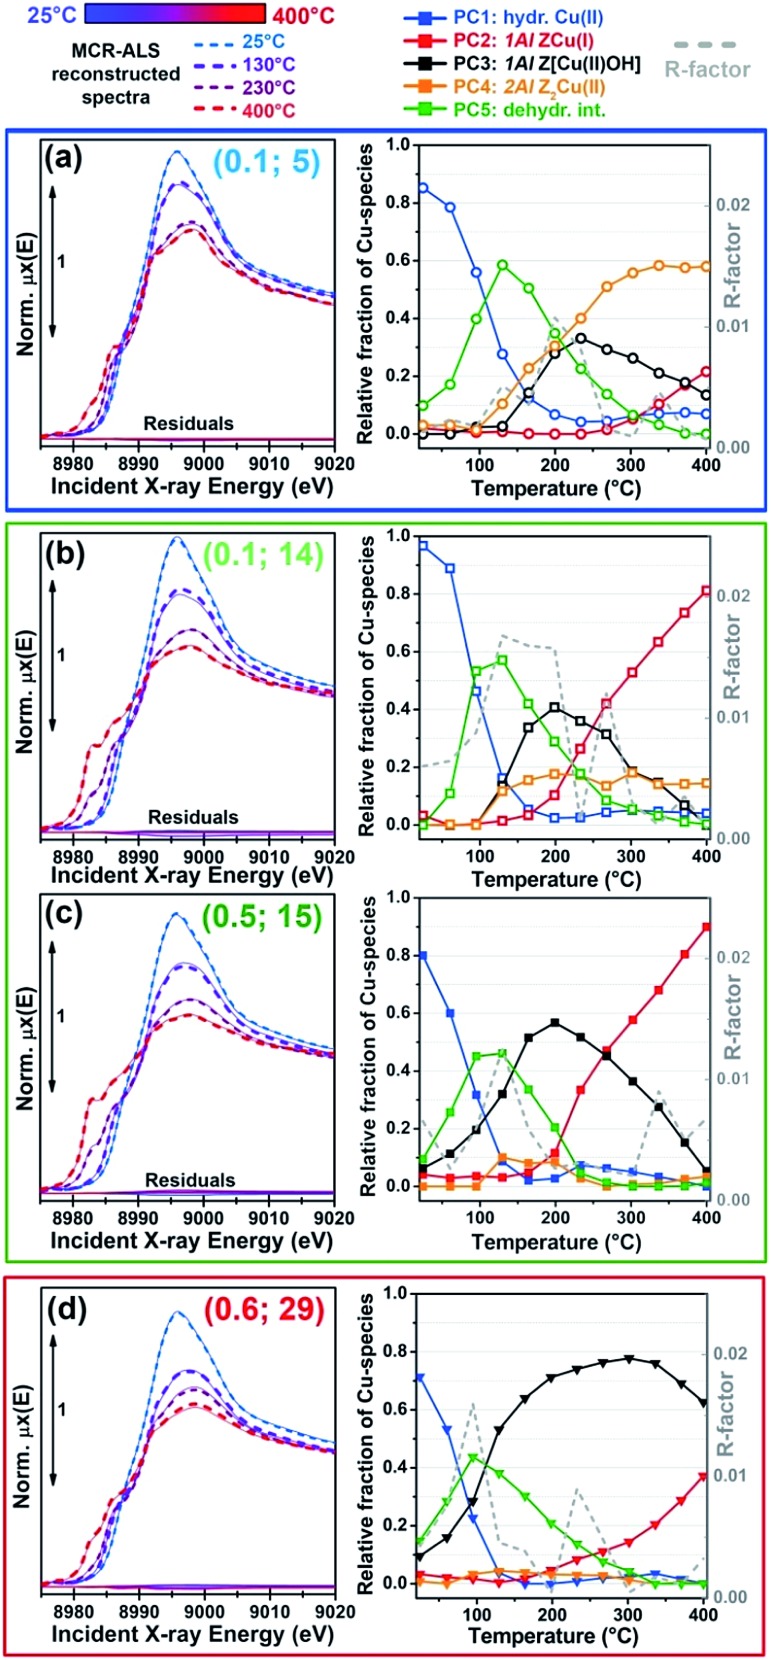
Fig. 4. Detailed MCR-ALS results for the most representative compositional points: (a) Cu/Al = 0.1, Si/Al = 5; (b) Cu/Al = 0.1, Si/Al = 14; (c) Cu/Al = 0.5, Si/Al = 15; (d) Cu/Al = 0.6, Si/Al = 29. Left panels: comparison between experimental in situ XANES μ exp during He-activation (thin solid lines) and reconstructed spectra μ rec from MCR-ALS (thick dashed lines) at the four key temperatures of 25 °C, 125 °C, 230 °C, and 400 °C with the corresponding residuals (thick full lines). Right panels: concentration profiles for the five pure Cu-species/sites identified in our model as a function of the activation temperature (coloured symbols) and correspondent R-factor values (grey dashed lines).

Fig. 4