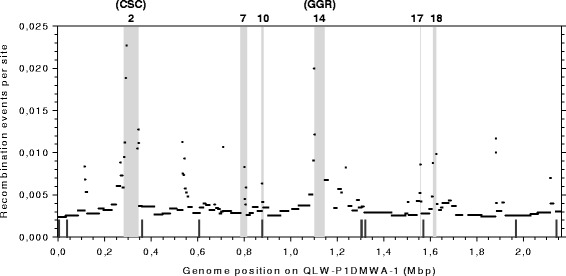
Fig. 4.

Frequency of recombination with respect to genome position. The y-axis indicates the frequency of recombination events as inferred by ClonalOrigin for each block in the core genome alignment of the nine P. asymbioticus strains. The x-axis shows the respective genome position, exemplarily for strain QLW-P1DMWA-1. Genomic islands which have been assigned to the replacement type in [64], i.e. presumably resulted from HR between the flanking sequences of the islands, are highlighted by grey areas and numbered according to their genomic position defined earlier (Fig. 3C in [64]). CSC (cell surface composition) and GGR (giant gene region), designated as in [64], are typical examples of replacement genomic islands (cf. [83]). The position of the loci used for MLST is indicated by short lines at the bottom of the graph
