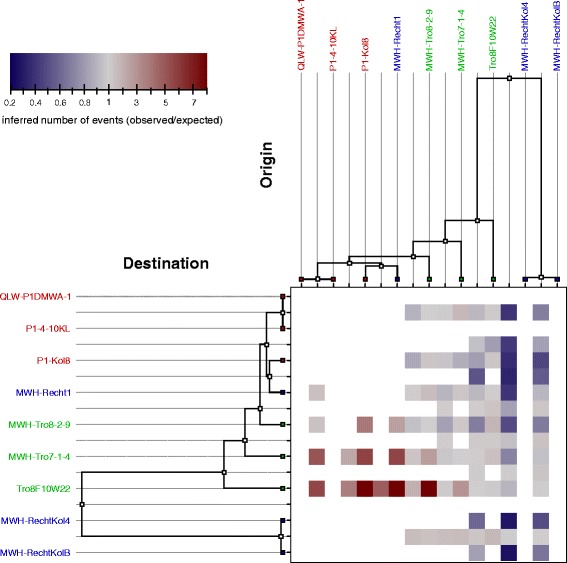
Fig. 5.

Flux of recombination. Heat map showing the number of recombination events inferred by ClonalOrigin relative to its expectation under the prior model for each donor/recipient pair of branches. Cells for which both the number of observed and expected events are less than three are left white. The underlying numbers are given in Additional file 5
