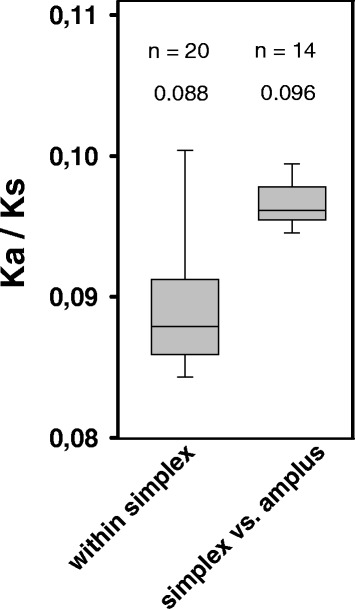
Fig. 6.

Boxplot of Ka/Ks values. The middle lines indicate median values, the outer lines of the boxes represent the 25th and 75th, and the whiskers the 5th and 95th percentiles. Sample sizes (n) and median values are given above the plots. There is a statistically significant difference between the median values of the two groups shown according to the Mann-Whitney rank test (p ≤ 0.001). The Ka/Ks between the two almost identical simplex genomes (QLW-P1DMWA-1 and P1–4-10KL) is 6.6 and was excluded from these analyses. The Ka/Ks between the two amplus genomes is 0.092 (Additional file 6)
