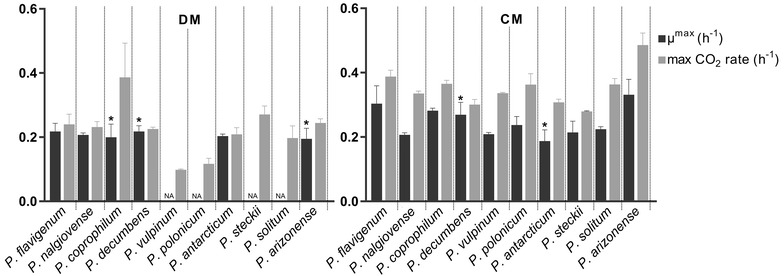
Fig. 3.

Maximum specific growth rates and maximum CO2 production rates for ten Penicillium species cultivated in 1 L bioreactors in DM and CM. Dark grey bars: maximum specific growth rates µmax (h−1) and standard deviations calculated by linear regression of minimum three biomass dry weight data points during the exponential phase. For P. vulpinum, P. polonicum, P. steckii, and P. solitum in DM there were less than three dry weight samples during exponential phase and therefore µmax could not be calculated. Light grey bars: maximum production rate of CO2 (h−1) and standard deviations calculated by linear regression of accumulated CO2 values during exponential growth. All values are based on independent triplicate fermentations, except for the ones with an asterix; there the values are based on duplicate fermentations
