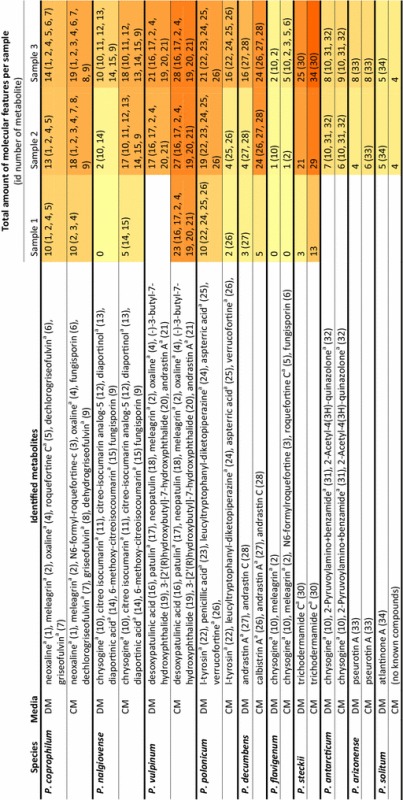
Table 2.
Metabolites produced in different growth phases of ten Penicillium species

Column 3: metabolites (and their id numbers) identified with dereplication, in order of retention time. Column 4, 5 and 6: per sample the total amount of molecular features (identified and unknown metabolites), in between brackets the id number of the identified compounds in each sample. A heat map from yellow to dark orange follows the total amount of molecular features in the samples
aConfirmed with a reference standard
