
Figure 1.
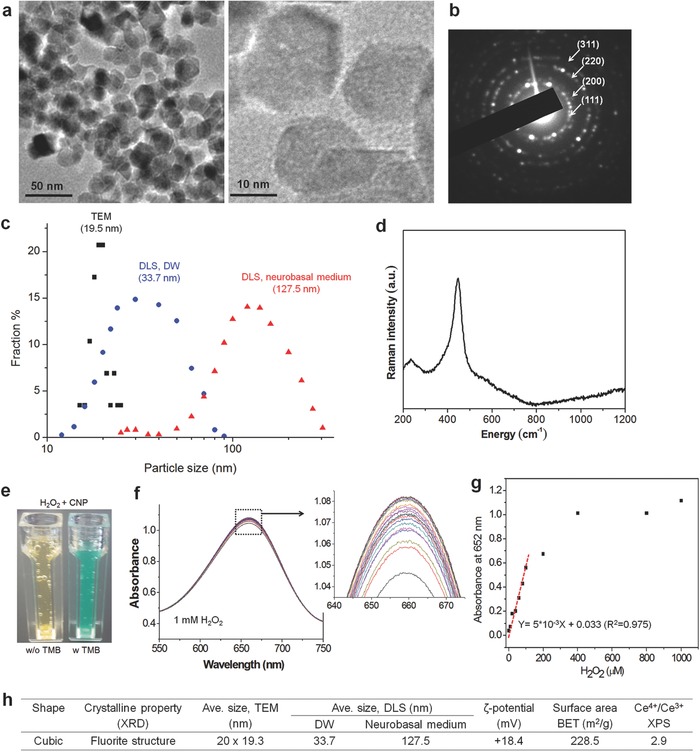
Characteristics of cerium oxide nanoparticles (CONPs). a) TEM images of CONPs at low and high magnification, and b) selected area diffraction pattern of the crystal. c) Size distribution of CONPs, calculated from TEM images and also measured by DLS (in DW or neurobasal medium). d) Raman spectrum. e–g) Oxidase‐like activity of CONPs, evaluated by monitoring the redox reaction between TMB and H2O2 in the presence of the CONPs; optical view showing a color change by the reaction (e), UV–vis spectroscopic intensity measured time‐dependently (20 cycles per 5 min) at a broad wavelength scan using 1 × 10⁻³ m H2O2 (f) and then recorded at a specific peak 652 nm with varying H2O2 dose up to 1000 µm (showing a linear relationship up to ≈100 µm) (g). h) Summary of properties including shape, size (by TEM and DLS method), ζ‐potential, surface area (by BET), and Ce atomic oxidation status (Ce4+/Ce3+, by XPS).13