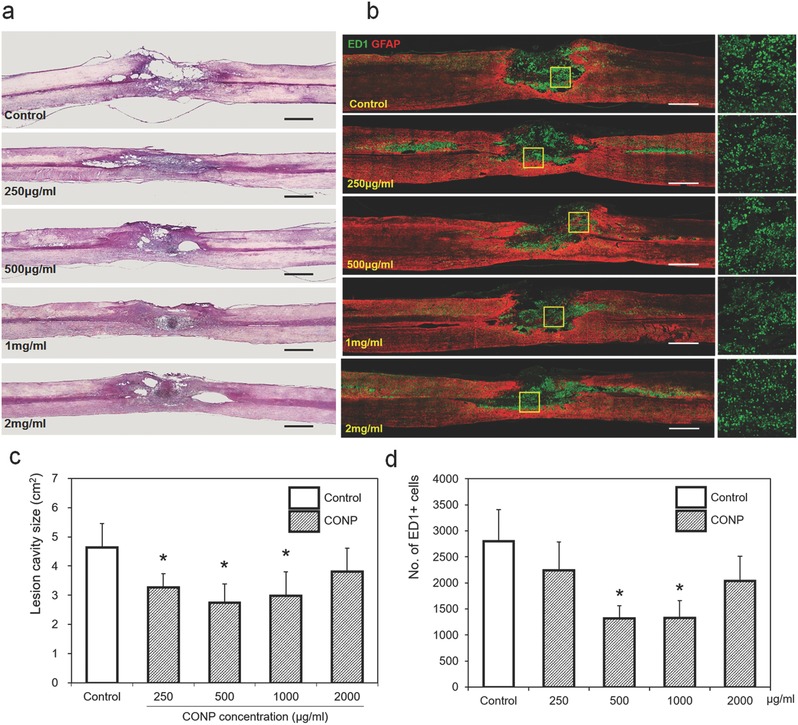
Figure 4.

Representative a) H&E and b) immunohistochemical images of the injured spinal cord eight weeks after the application of CONPs with different concentrations from 250 to 2000 µg mL−1. The yellow boxes magnified on right side. c) Size of lesion cavity measured from the sagittal images of H&E staining, and d) number of ED1‐positive inflammatory cells calculated from the sagittal images of immunohistochemistry. Scale bar = 1 mm. *p < 0.05 compared with control by Mann–Whitney U test.
