
Figure 5.
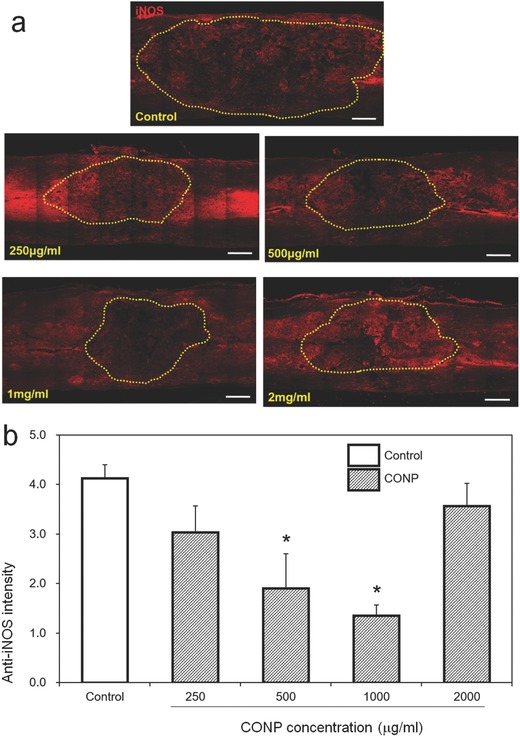
In vivo iNOS generation assay. a) Represent images of anti‐iNOS positive cells within injured spinal cord 24 h after the SCI. The lesion cavity outlined by yellow dots. b) Relative intensity of anti‐iNOS positive cells quantified. Scale bar = 500 µm. *p < 0.05 compared with control by Mann–Whitney U test.