
Figure 5.
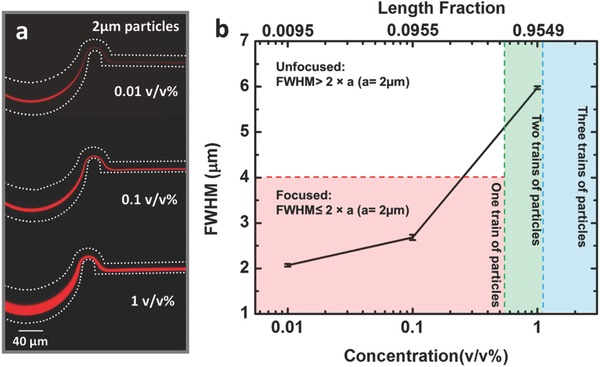
The dependence of focusing efficiency on the initial suspension concentration for 2 µm particles. a) The measured FWHM visibly increases as particle concentration is increased. b) The lower left region (pink) denotes the range of 2 µm particle concentrations that theoretically can be focused onto a single particle train (pathline). The data points in this region demonstrate that focusing is achieved. The region above this (white) represents unfocused operation. The adjacent region (green) corresponds to a range of particle concentrations (≈0.52–1.05 v/v%) that cannot physically fall onto a single pathline, but may form two adjacent particle trains. Using this as a focusing criterion, the results for the 1 v/v% suspension indicate that focusing is achieved. The final region in the plot (blue) denotes focusing for concentrations above ≈1.05 v/v%. The white dashes represent the microchannel boundaries. Error bars represent standard deviation with a sample size of three.