
Figure 6.
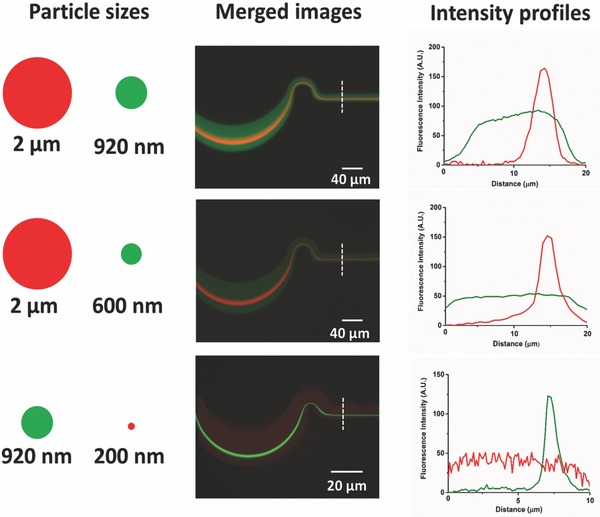
Micrometer and sub‐micrometer particle separation. The left legends show the relative particles sizes and their corresponding florescence colors; the middle images are the merged fluorescence photos of two particles with difference sizes tested in the same microchannel at the same flow rates; the right plots are the intensity profiles of corresponding particles.