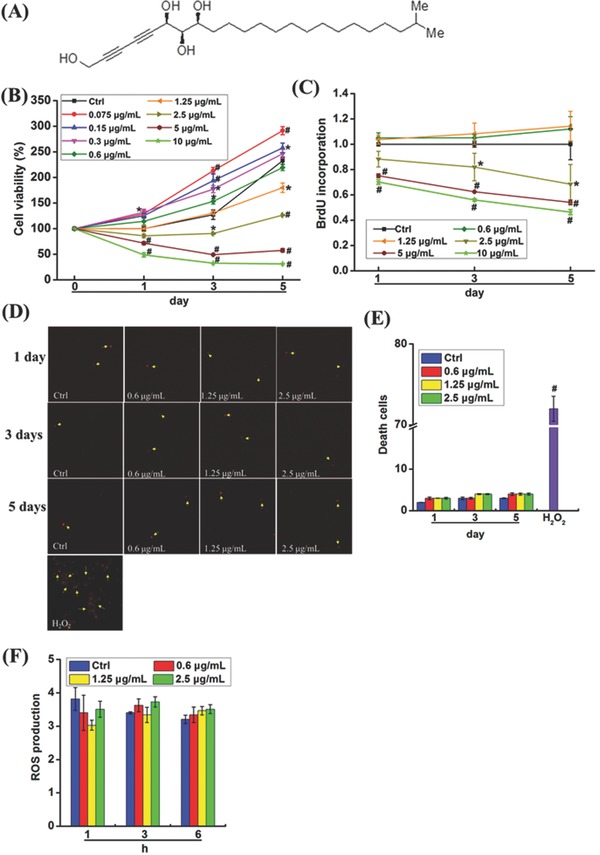
Figure 1.

Screening of sublethal concentrations of Petrosiol E in PC12 cells. A) The chemical structure of Petrosiol E. B) Cell viability was determined through the MTT assay in PC12 cells treated with Petrosiol E at different concentrations for 1, 3, and 5 d (n = 6). C) Cell proliferation was assessed by the BrdU incorporation assay at indicated concentrations for 1, 3, and 5 d (n = 6). D) Dead cells were determined by PI staining after Petrosiol E treatment at 0.6, 1.25, and 2.5 µg mL−1 for 1, 3, and 5 d (n = 6). H2O2 (at 5 mmol L−1) was used as a positive control to induce cell death. E) Quantitative analysis of dead cells after PI staining (n = 6). F) Levels of ROS were detected via DCFH‐DA probe in PC12 cell upon Petrosiol E exposure (n = 6). Experiments were repeated for three times. *: P < 0.05, relative to untreated control. #: P < 0.001, relative to untreated control.
