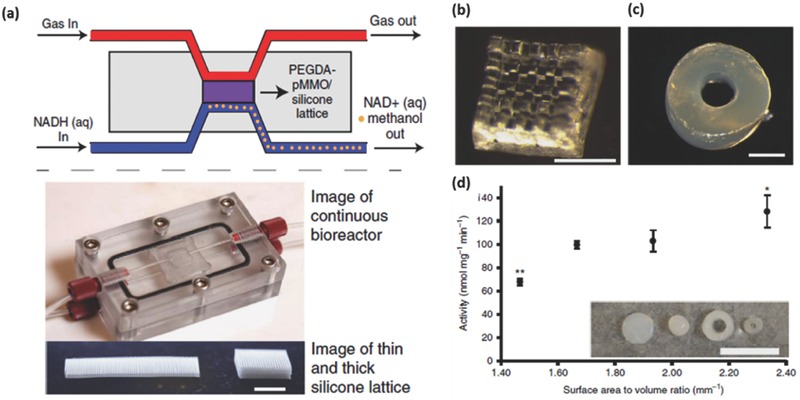
Figure 15.

a) Schematics and image of the flow‐through bioreactor and 2 silicon lattice structures used to support PEG‐pMMO hydrogel membrane (scale bar 1 cm); b) PµSL printed PEG‐pMMO grid structure with small feature size (scale bar, 500 µm); c) PµSLA printed PEG‐pMMO cylinders with varying surface area to volume ratios on a shorter timescale with reduced resolution (scale bar, 1mm); d) The dependence of PEG‐pMMO activity on surface area to volume ratio, insert: printed cylinders with surface to volume ratios of 1.47, 1.67, 1.93 and 2.33 (scale bar, 10 mm). Reproduced with permission.183 Copyright 2016, the authors. Published under CC‐BY 4.0 license.
