Fig. 1.

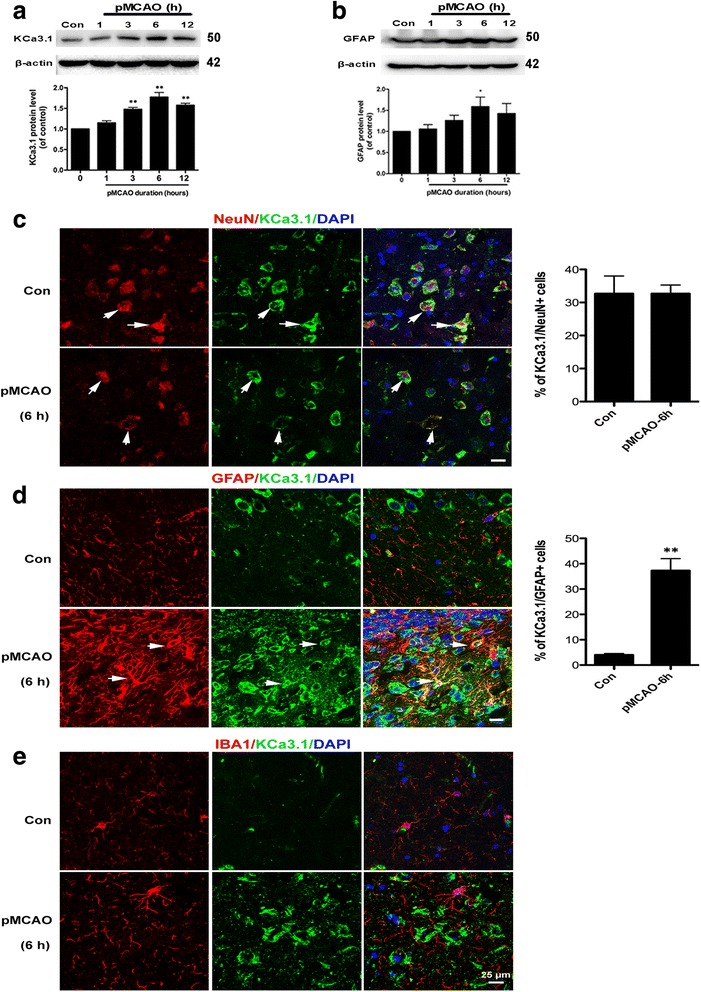
Upregulation of KCa3.1 channels and GFAP in mouse brains following pMCAO. a, b Western blot analysis of lysates from 10-week-old male WT mice following 1, 3, 6, or 12 h of pMCAO analyzed by antibodies to KCa3.1 (a) and GFAP (b). Data represent the means ± SEM of KCa3.1 and GFAP density normalized to β-actin values for n = 3. * p < 0.05, ** p < 0.01, one-way ANOVA followed by the Dunnett’s multiple comparison test compared with control. Con control. c–e Cellular localization of KCa3.1 channels in mouse brains following pMCAO. Double immunofluorescence analysis of KCa3.1 (green) levels in (c) neurons (NeuN, red), (d) astrocytes (GFAP, red), and (e) microglia (Iba1, red) of control and 6 h pMCAO mouse brain. DAPI (blue) was used to label nuclei. Quantification of the percentage of NeuN+ (c) or GFAP+ (d) cells colabeled for KCa3.1 at 6 h pMCAO compared with the control group. ** p < 0.01, unpaired, two-tailed Student’s t test compared with control mice (n = 4). Scale bar: 25 μm. Con control
