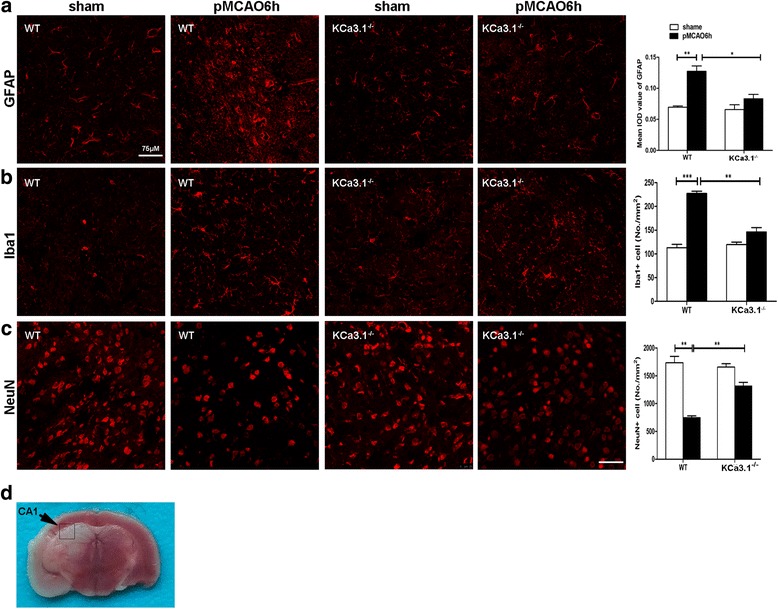
Fig. 3.

Decreased glial activation and neuronal loss in brains of KCa3.1 deletion mice following pMCAO. Reactive astrocytes (a), activated microglia (b), and neurons (c) from the hippocampal CA1 regions of WT or KCa3.1−/− mice at 6 h after pMCAO were visualized by GFAP, Iba1, and NeuN immunostaining, respectively. At least four coronal slices from each mouse brain and at least three brains of each genotype were used for immunostaining and counting. n = 4 per group. Scale bar: 75 μm. Data represent means ± SEM. * p < 0.05, ** p < 0.01, *** p < 0.001, unpaired, two-tailed Student’s t test. d Images of Fig. 3a–c were taken from CA1 regions (black box). WT, wild type
