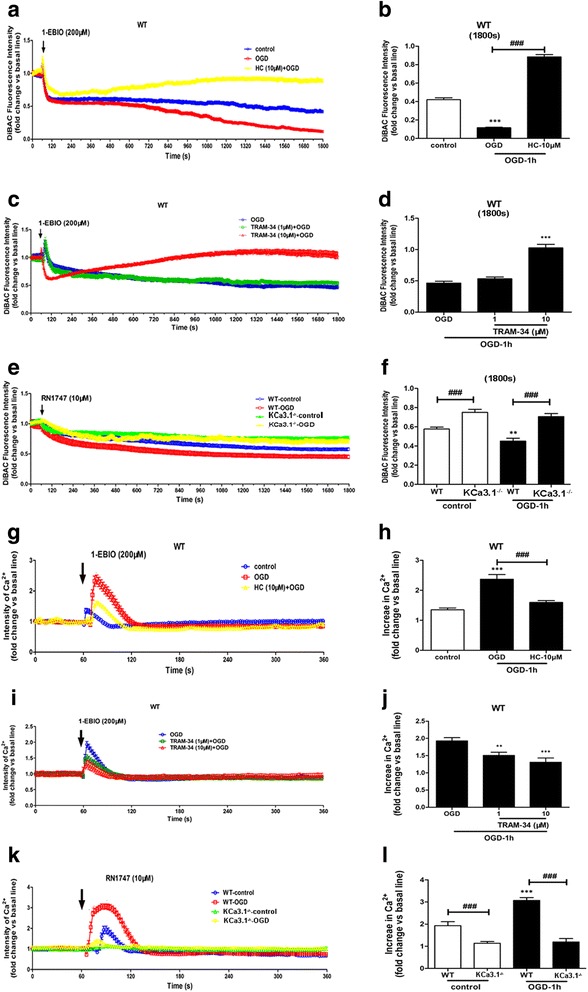
Fig. 5.

Role of TRPV4 and KCa3.1 in alteration of membrane potential and Ca2+ entry in astrocytes following OGD. a–f Changes in membrane potential in response to activation of KCa3.1 channels and TRPV4 channels in astrocytes exposed to OGD 1 h. a, b 1-EBIO was added to WT astrocytes and membrane potential measured with or without OGD or HC 067047. Data are presented as means ± SEM. n = 10–20. *** p < 0.001 vs control. ### p < 0.001 vs OGD. c, d 1-EBIO was added to WT astrocytes and membrane potential measured with or without OGD or TRAM-34 (1 and 10 μM). Data are presented as means ± SEM. n = 10–20. *** p < 0.001 vs OGD. e, f RN1747 was added to WT or KCa3.1 KCa3.1−/− astrocytes and membrane potential measured with or without OGD. b, d, f Summary of data showing the membrane potential in a, c, and e at 1800s. Data are presented as means ± SEM. n = 10–20. ** p < 0.01 vs WT control, ### p < 0.001 vs WT control or WT OGD. g–l Changes in [Ca2+]i in response to activation of KCa3.1 channels and TRPV4 channels in astrocytes exposed to OGD 1 h. g, h 1-EBIO was added to WT astrocytes and [Ca2+]i measured with or without OGD or HC 067047. Data are presented as means ± SEM. n = 10–20. *** p < 0.001 vs control. ### p < 0.001 vs OGD. i, j 1-EBIO was added to WT astrocytes and [Ca2+]i measured with or without OGD or TRAM-34 (1 and 10 μM). Data are presented as means ± SEM. n = 10–20. ** p < 0.01, *** p < 0.001 vs OGD. k, l RN1747 was added to WT or KCa3.1 KCa3.1−/− astrocytes and [Ca2+]i measured with or without OGD. h, j, l Summary of data showing the [Ca2+]i in h, j, and l at 70–80 s. Data are presented as means ± SEM. n = 10–20. *** p < 0.001 vs WT control, ### p < 0.001 vs WT control or WT OGD. Statistical analysis was performed using unpaired, two-tailed Student’s t test. 1-EBIO, 1-ethyl-2-benzimidazolinone, OGD oxygen-glucose deprivation, WT wild type, HC HC 067047
