Fig. 6.

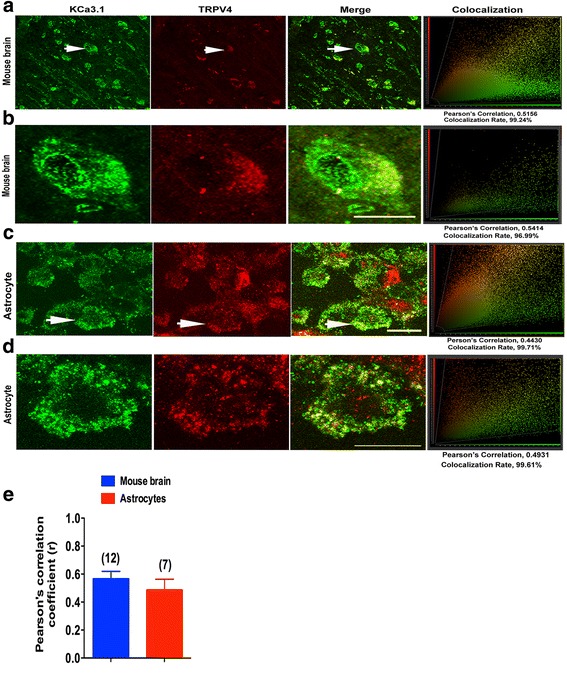
KCa3.1 and TRPV4 co-localized in primary cultured astrocytes and mouse brain cortex. Double immunofluorescence images of KCa3.1 (green) and TRPV4 (red) in normal mouse brains (a, b), and primary cultured astrocytes (c, d). Note the strong co-localization indicated by merge yellow fluorescence, quantification of the co-localization observed in experiments as shown in g. (e) The histograms represent the ratio of the mean Pearson correlation coefficient calculated from the co-labeling in a number of samples, as indicated above the bar. Scale bar: 25 μm
