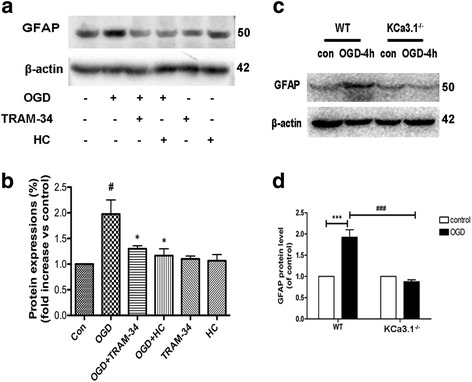
Fig. 7.

Involvement of KCa3.1 in OGD-induced reactive astrogliosis. a, b Representative western blot showing GFAP expression in cultured astrocytes treated with OGD for 4 h in the presence of 1 μM TRAM-34 and 10 μM HC 067047. Quantification of western blot for GFAP expression (n = 3). Data are presented as means ± SEM. # p < 0.05 vs control, * p < 0.05 vs OGD alone. c, d Representative western blot and quantification of GFAP expression after 4 h OGD treatment in WT and KCa3.1 KCa3.1−/− astrocytes (n = 3–4). *** p < 0.001, ### p < 0.001. One-way ANOVA followed by the Dunnett’s multiple comparison test. Con control, WT wild type
