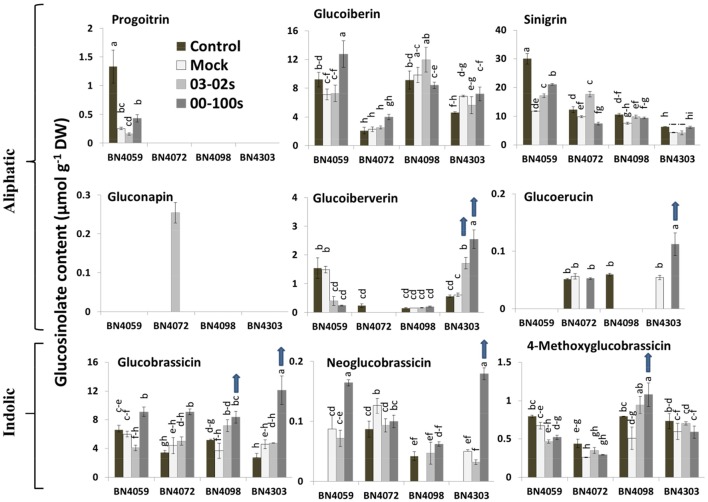
Figure 2.
Glucosinolate contents of leaf samples from the four cabbage lines (BN4059, BN4072, BN4098, and BN4303) under four different treatments (control, mock, inoculation with 03–02 s or 00–100 s) four days after inoculation. Detection limit of glucosinolates was 0.025 μmol g−1 DW. The mean of three biological replicates is presented. Vertical bars indicate standard error of mean. Different letters indicate statistically significant differences between genotype × treatment combinations. Upward-pointing blue arrows indicate increased glucosinolate content in response to L. maculans infection.

