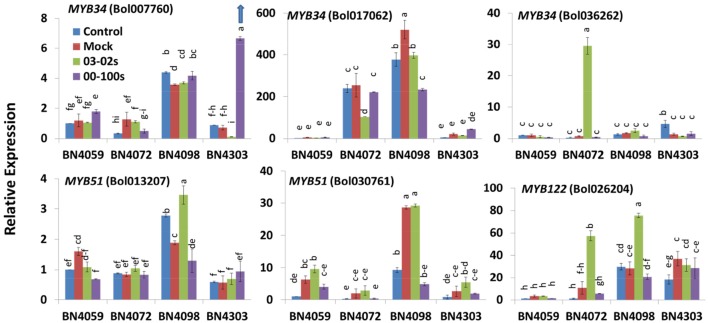
Figure 4.
Relative expression of indolic glucosinolate transcription factor related genes in leaf samples from the four cabbage lines (BN4059, BN4072, BN4098, and BN4303) under four different treatments (control, mock, inoculation with 03–02 s or 00–100 s) four days after inoculation. The mean of three biological replicates is presented. Vertical bars indicate standard error. Different letters indicate statistically significant differences between genotype × treatment combinations. Upward-pointing blue arrows indicate increased glucosinolate content in response to L. maculans infection.

