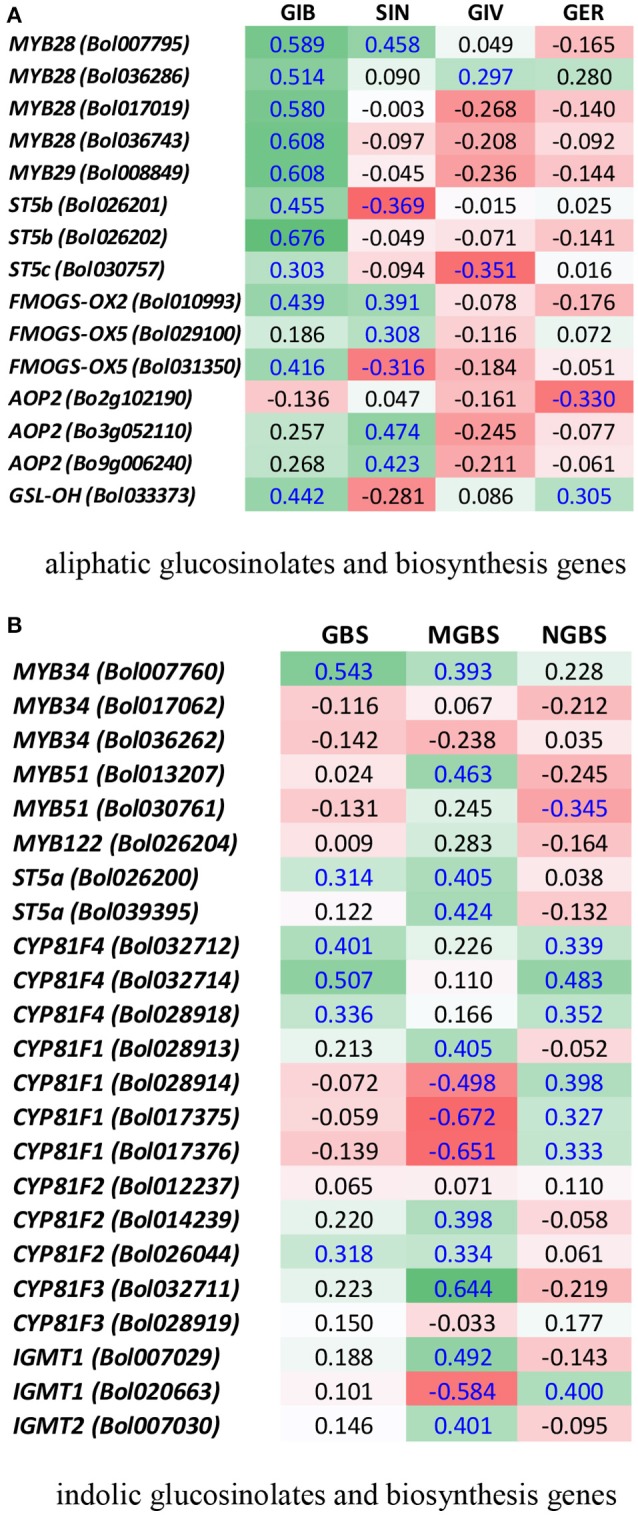
Figure 7.

Heatmap showing correlation between the levels of aliphatic (A) and indolic (B) glucosinolates and expression of biosynthesis genes under four treatments in four cabbage lines. Blue letters represent statistically significant correlation (p < 0.05). For each gene and glucosinolate combination, the values indicate Pearson correlation coefficient. Green cells represent positive correlation and red cells represent negative correlation. GIB, Glucoiberin; SIN, sinigrin; GIV, glucoiberverin; GER, glucoerucin; GBS, glucobrassicin; NGBS, neoglucobrassicin; and MGBS, methoxyglucobrassicin.
