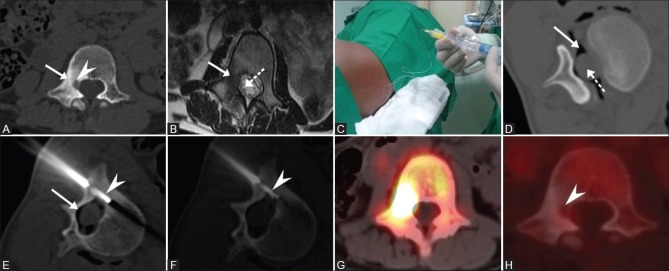
Figure 2 (A-H).
(A) CT image shows nidus (arrowhead) in the right pedicle of L1 vertebra with adjacent sclerosis (solid arrow). (B) T2W axial MR image shows dependent nerve root (dotted arrow) within the thecal sac close to the nidus. (C) Air was insufflated via needle placed within the epidural space. (D) CT axial image shows epidural air (solid arrow) separating the thecal sac (dotted arrow) from the nidus. (E and F) RFA electrode (dotted arrow) placed within the nidus. Pre RFA (F-18) PET CT (G) shows avid uptake within the nidus and complete metabolic regression (arrowhead) in post RFA scan (H)

