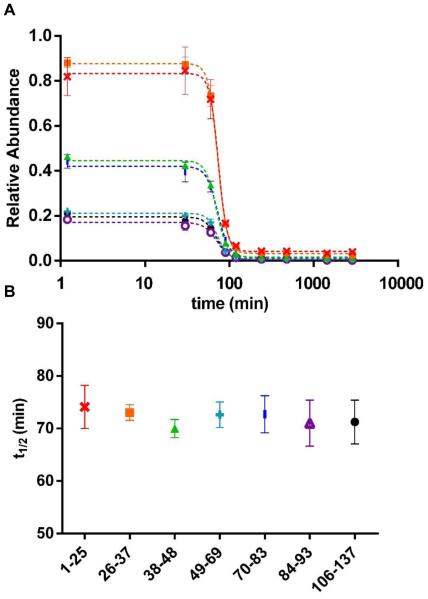
Figure 1.
(A) Relative abundance of CsgA peptides with respect to the internal standard as a function of incubation time for peptide 1–25  , 26–37
  , 38–48
  , 49–69
  , 70–83
  , 84–93
  and 106–137
  . Data were fit with sigmoidal curves (dotted line). Error bars are standard deviation at each time point. (B) t1/2 value of each peptide extracted from sigmoidal curve fitting with errors indicating t1/2 ranges at 95% confidence level.

