Figure 2.
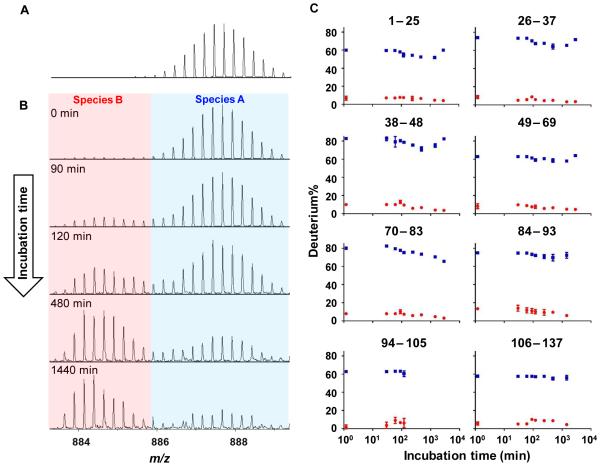
HDX mass spectra of peptide 106–137 molecular ion (A) in the presence of GdnHCl and (B) in the absence of GdnHCl incubated for 0, 90, 120, 480, and 1440 min. The isotope cluster at higher m/z range is denoted as species A (blue) whereas the one at lower m/z range is denoted as species B (red) (C) Deuterium uptake of both species A (blue) and B (red) as a function of incubation time for all peptides. The relative abundance of peptide 106–137 to the internal standard is 21%, 4%, 1%, 0.9%, 0.5% at 0, 90, 120, 480, and 1440 min, respectively, as plotted in Figure 1.

