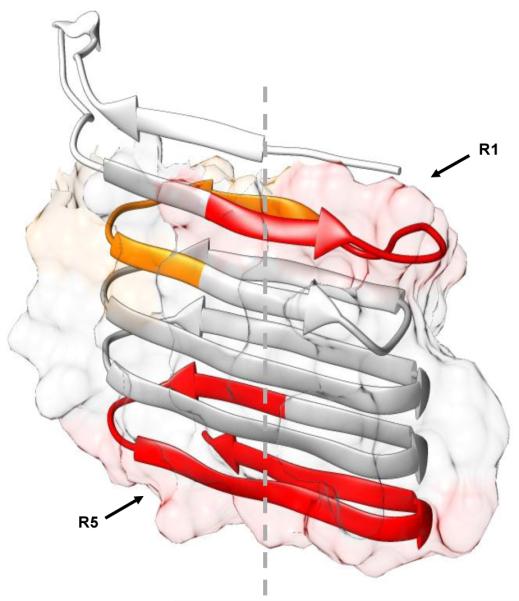
Figure 4.

Relative increasing rates of fraction B species mapped onto a computed CsgA monomer structure. Colors were coded the same way as in Figure 3: 26–37 in red, 38–48 in orange, 106–137 in dark red, and the remaining peptides in gray. Surface areas of amyloid core (23–131) that contains five imperfect repeats, calculated in UCSF Chimera,40 are shown as the background to backbone structure. Dashed line indicates the proposed primary fibril growth direction.
