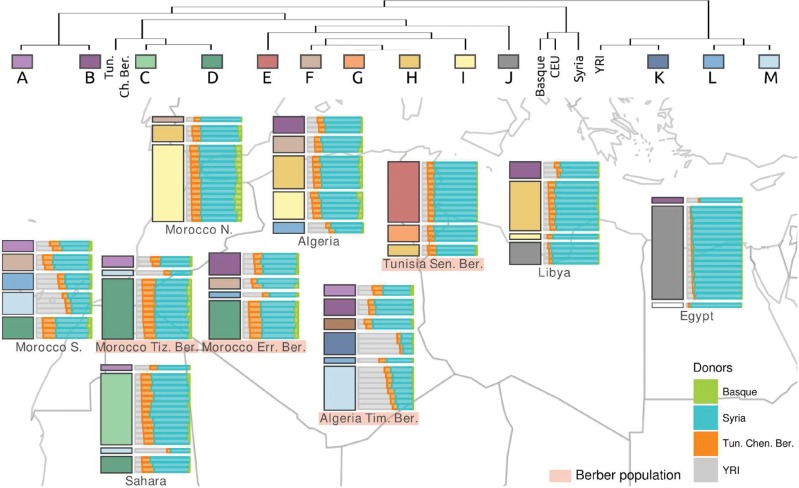
Fig. 3.
Haplotype sharing and FineStructure cluster distribution in North Africa. The right horizontal barplots in each geographic location show individual proportions of inferred haplotype sharing with Yoruba, Tunisian Berbers from Chenini, Syrians, and Basques, estimated using a mixture model that incorporates ChromoPainter results (colors according to the bottom right legend in the figure). Within each geographic location, left vertical barplots show the proportion of individuals from each population assigned to each of 13 North African fineSTRUCTURE genetic clusters (colors match the fineSTRUCTURE simplified dendrogram represented at the top of the figure).

