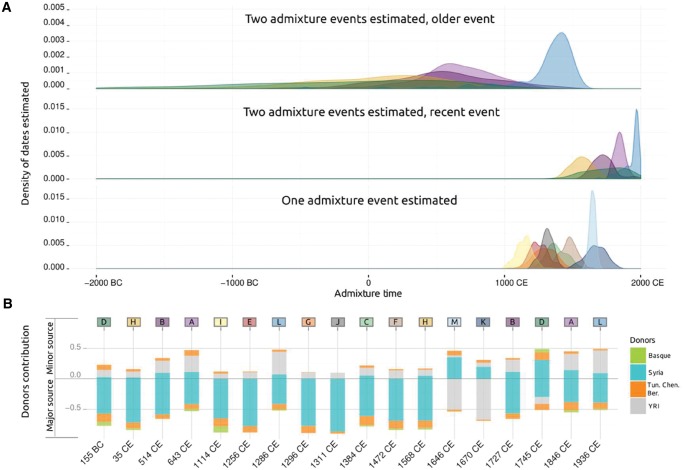
Fig. 5.
Globetrotter estimations in North Africa. (A) The three density plots on the top of the figure show the admixture times estimated for each cluster for each of 100 bootstrap re-samples: top, older event when two admixture events are estimated; middle, recent event when two admixture events are estimated, and; bottom, only one admixture event estimated. (B) The barplot at the bottom of the figure shows the proportion of the four components (Middle Eastern, North African, sub-Saharan, and European) inferred in each cluster, considering the minor source (up) and major source (down) and the estimated times of admixture.

