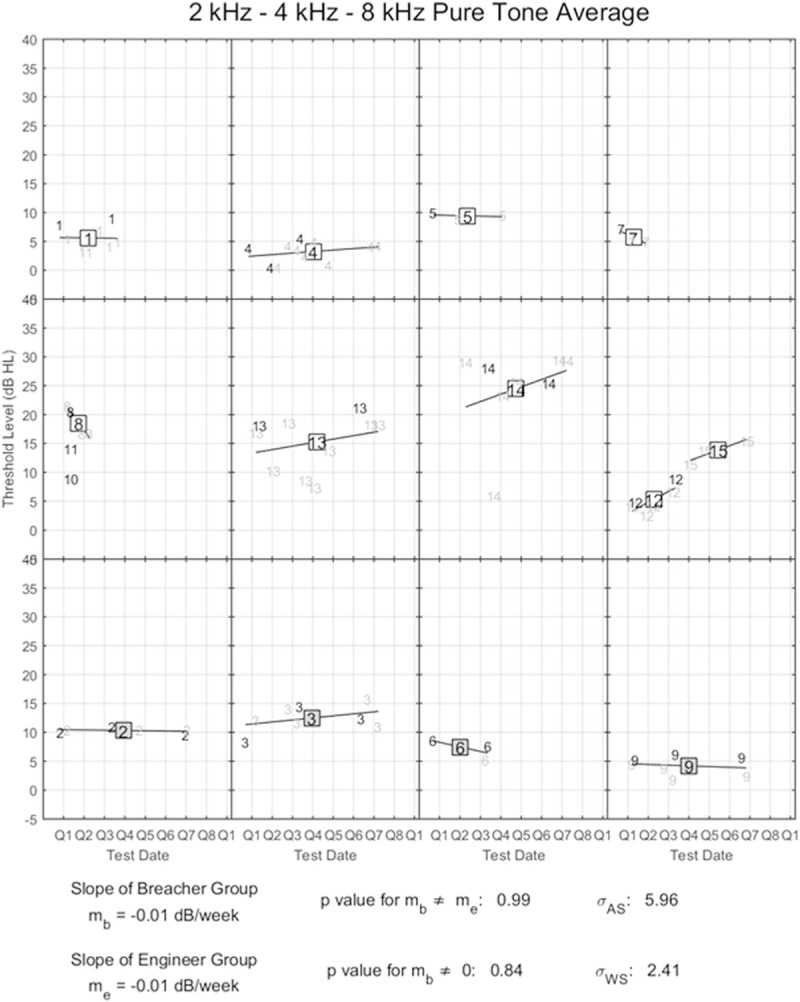
Figure 1.

Longitudinal analysis of 2-4-8 kHz high frequency PT average for Breacher and Engineer groups. Each data point represents a different measurement, with the dark digits indicating baseline audiograms measured at Walter Reed and the light gray digits indicating field measurements made during a class held at MCB Quantico. The regression lines associated with Breachers are shown by the white squares in the first two rows, while those associated with Engineers are indicated by the gray squares in the bottom row of the figure. See text for details.
